by Thomas Kerscher
Determining Coordination Needs for Strategy Implementation
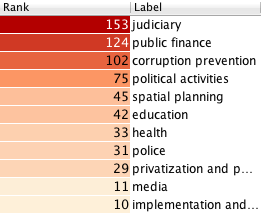
One of the most important issues for implementing a strategy is the scope of coordination necessary to ensure that all parties have sufficient information to go about their tasks. The answer to the question of how much coordination is required depends on a complex set of factors, which requires further analysis. In our example, the Serbian Anti-Corruption Strategy (2013 – 2018), and its associated Action Plan (NACS), cover 11 areas (nine sectors or “fields”, plus “corruption prevention” and “implementation and monitoring”), 51 “objectives”, 216 “measures” and 655 “activities” – to be carried out by 48 ministries and agencies. The following ranking table show the distribution of activities across the 11 areas:
The number of activities and actors indicates a need for substantial coordination. This post makes coordination needs visible by making use of graphic network analysis. The focus of graphic representation is on evaluating the location of actors in the system, rather than their individual attributes. The size of nodes therefore does not necessarily indicate how influential an actor is. What matters are measures around the centrality of a node. These measures provide an insight into the various roles and groupings in the system — the connectors, leaders, bridges, isolates, clusters, core of the system, and who is on the periphery and who is central. The graphs result from using different force algorithms on the NACS. For this purpose, the original NACS data was refined, but not significantly changed. Only where timelines indicated “annual” or “ongoing”, these were replaced by the plan’s expiry date. The graphs consist of nodes (circles) and edges (lines connecting the circles). Where degree criteria are used, the larger the number of connections of a node, the bigger is its size. In this case, the size of a node thus indicates its importance for coordination. The fewer coordination activities exist between agencies, the stronger will be the repulsing force between them. The more coordination activities exist, the stronger will be the attracting forces. The behaviour of the graphs under these forces is simulated as if they were physical systems. In this simulation, the forces are applied to the nodes, pulling them closer together or pushing them further apart. This is repeated iteratively until the system comes to an equilibrium state, so that their relative positions do not change anymore from one iteration to the next. The graphs thus converge the NACS implementation system to a unique global optimum configuration.
Scope of Strategic Areas
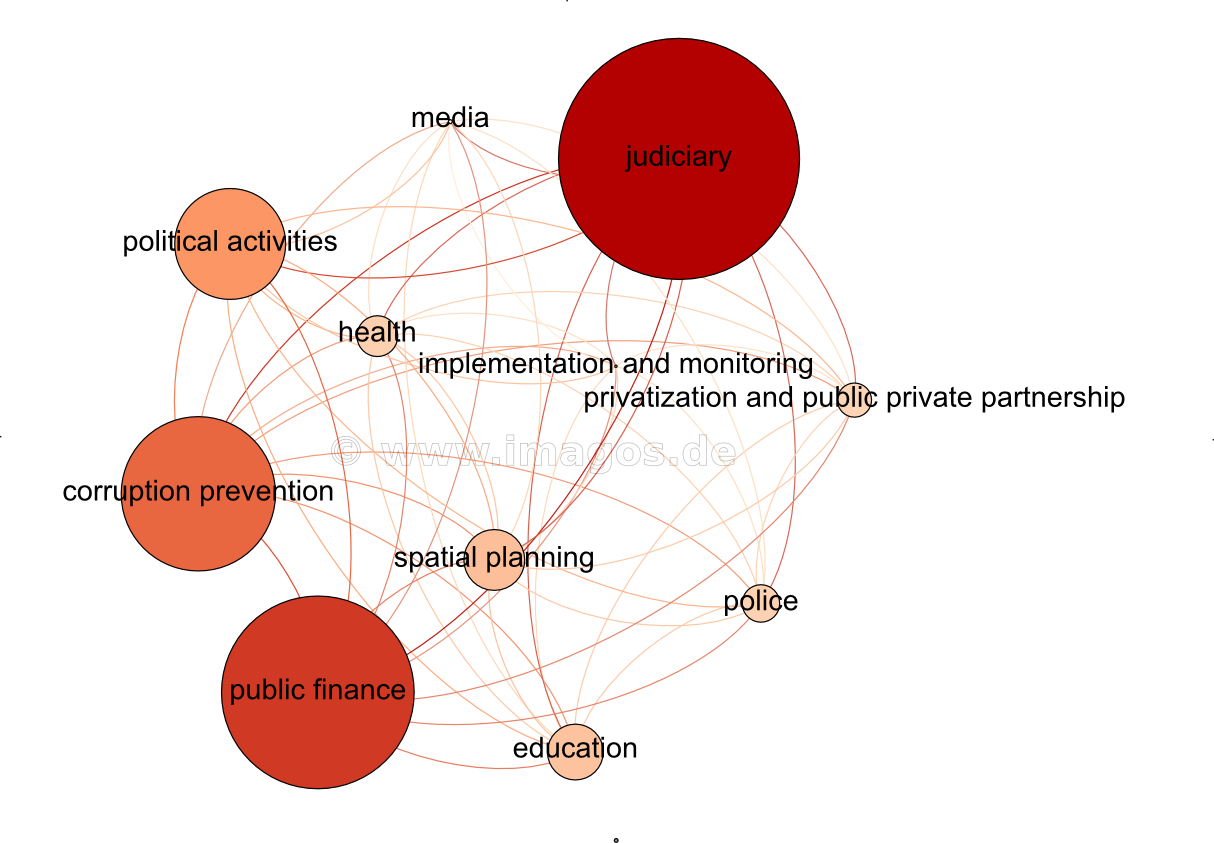
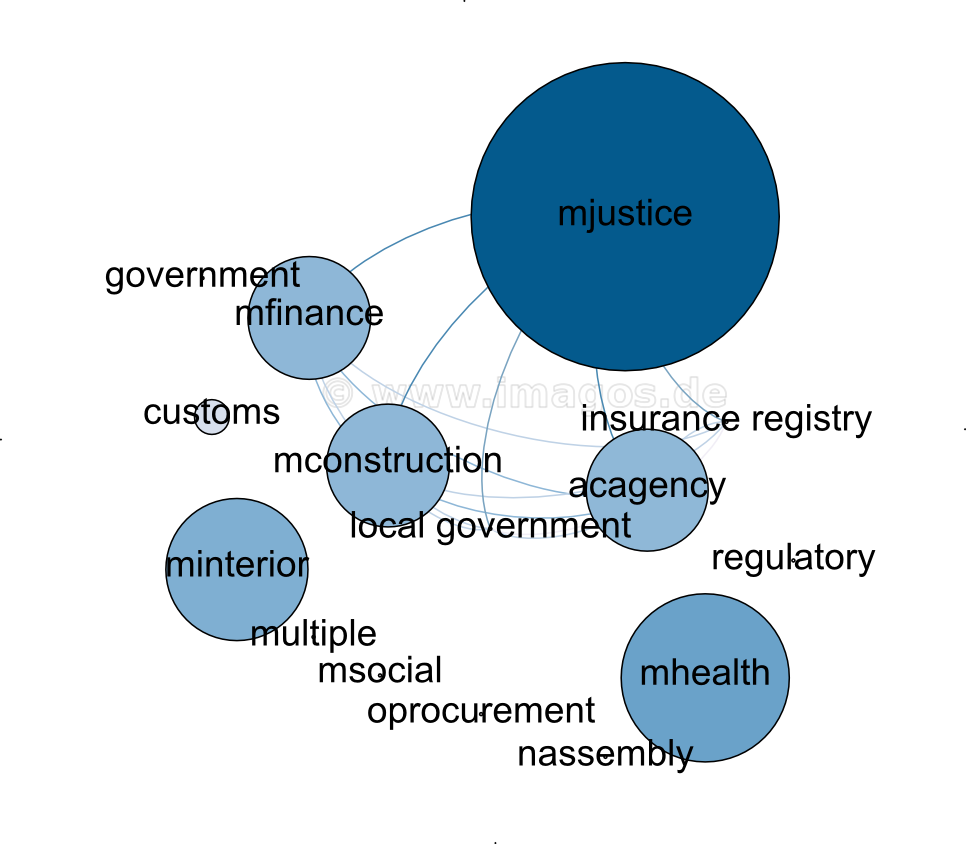
The first image displays all 11 areas as nodes. Two areas are connected when one agency is involved in both sectors at any time during the full lifespan of the strategy (2013-2018). The size of a node represents the number of activities in this sector (occurrence).
The judiciary is the target of the largest number of activities, while relatively few activities concern the implementation of the strategy in areas such as health, education, media, and police. The network density is 1.0, i.e. each area is directly connected to all other areas via at least one agency. Consequently, the network at this level is completely unstructured, so that there exist no “groups” within which certain areas would be more closely connected than others. This may not be a particularly efficient arrangement, but it has the advantage that all parties have some information of what goes on in other areas. In a context in which the information flow between agencies is traditionally slow, this may be an advantageous approach. In sum, the coordination capacity needed in each sector to implement the plan is high. An ensuing question thus is which agencies carry most of the coordination burden.
Most Relevant Agencies for Coordination
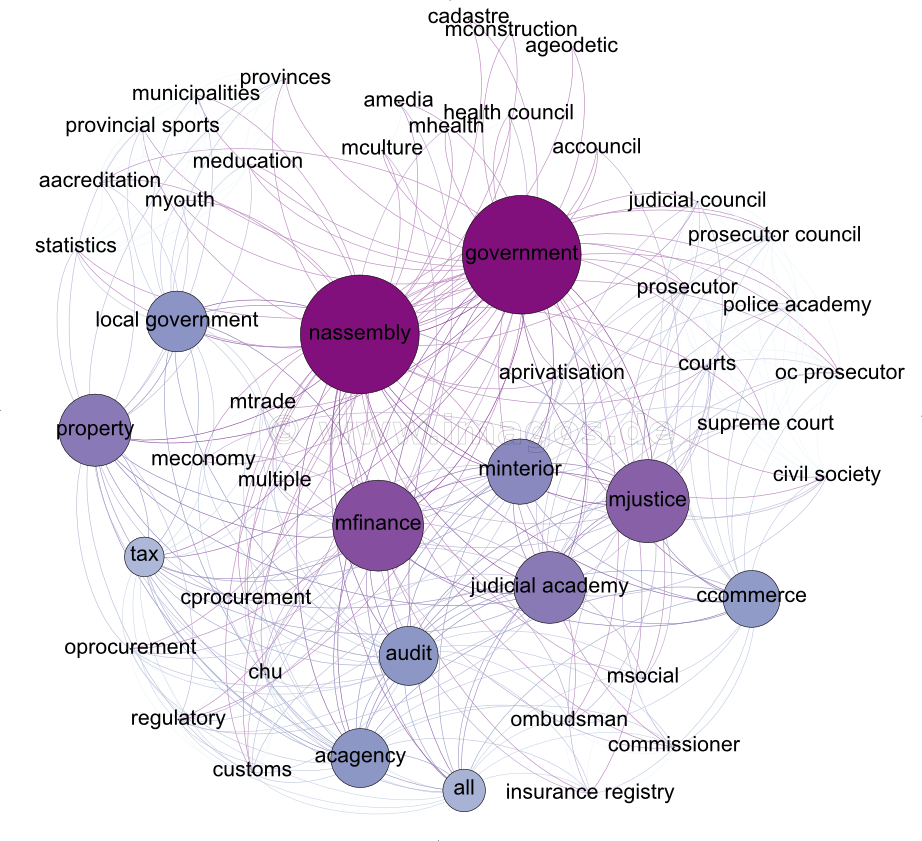
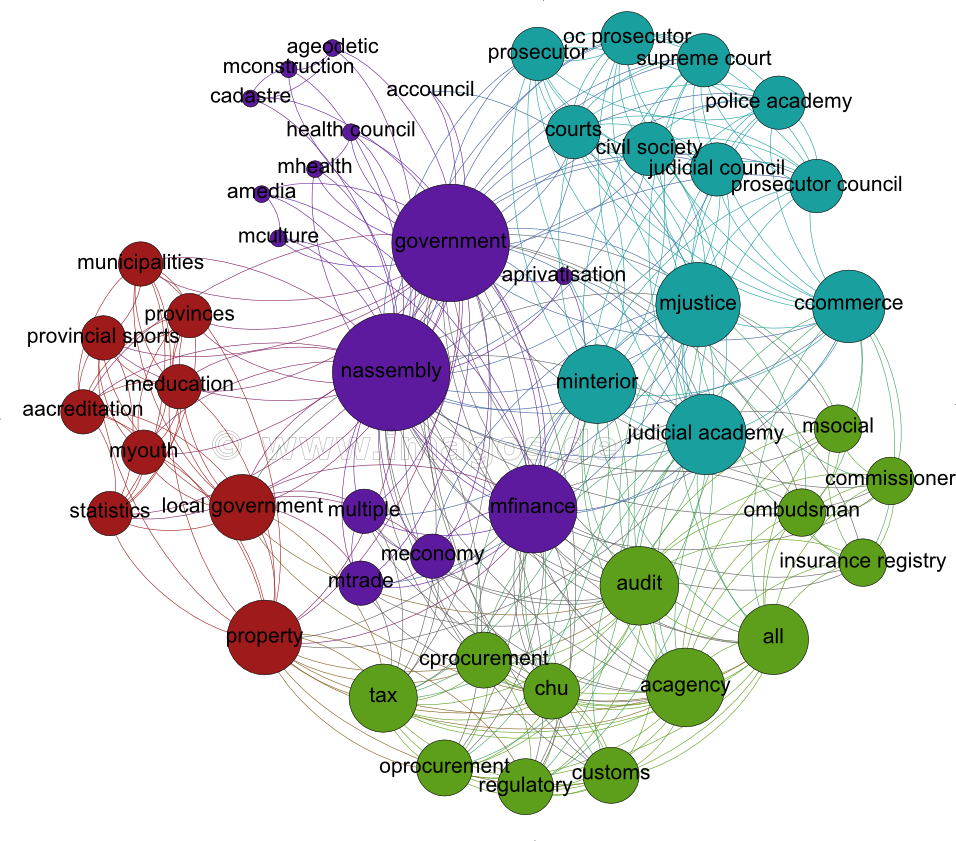
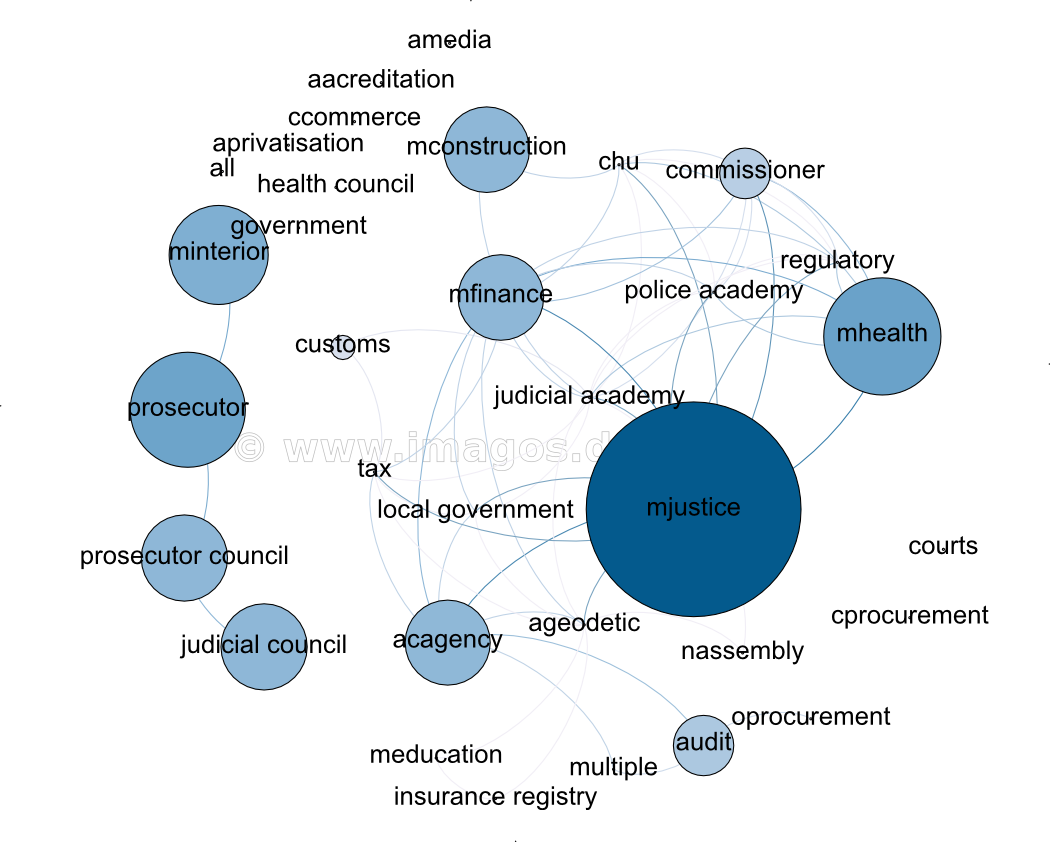
The next image shows the organizations and domains responsible for strategy implementation as nodes. Two agencies are connected when they work in the same area. The algorithm used is node “betweenness centrality” which measures how often a node appears on shortest paths between other nodes in the network. The larger the node size, the more effort an agency needs to spend on coordinating with other agencies. The graph demonstrates, for instance, that while the Ministry of Finance is responsible for an equally large number of activities, the most critical players for the coordination among strategic areas are Government and the National Assembly. These bodies will require the strongest coordination capacity at the level of strategic areas. On the other hand, they might become bottlenecks if that capacity was insufficient or missing.
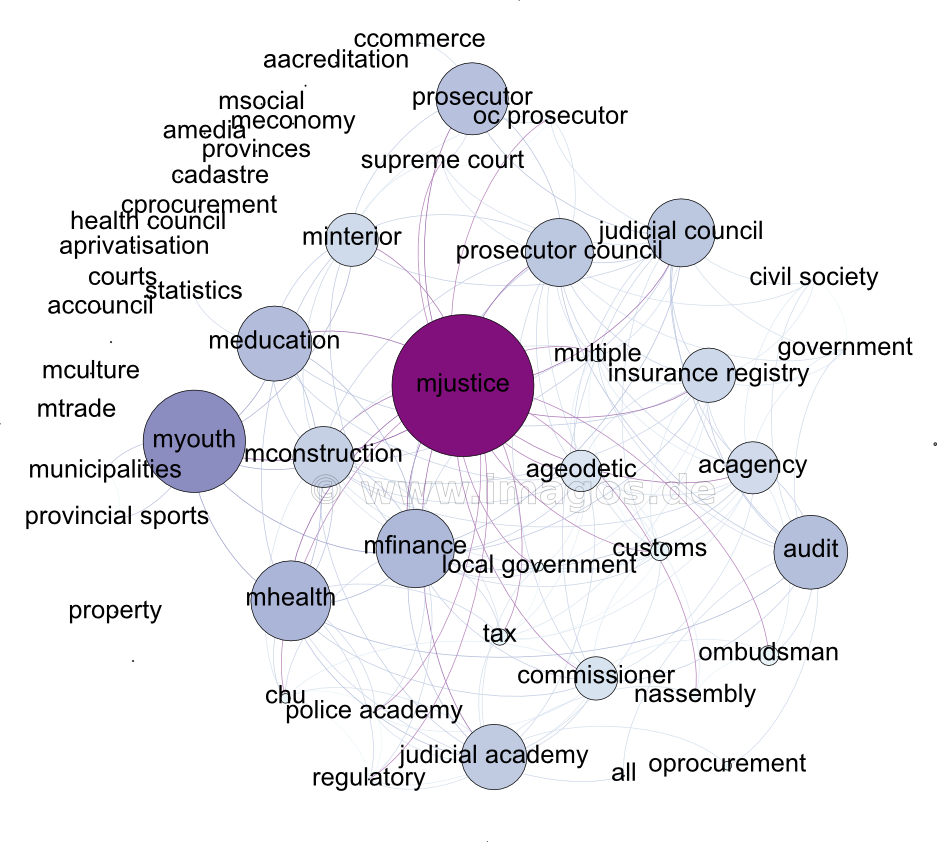
This situation changes significantly when analysing the centrality of actors at the level of activities. At this level, the Ministry of Justice becomes the dominant player for coordination. Central Government and the National Assembly play only a peripheral role in coordinating activities. Both at the levels of areas and activities, the Anti-Corruption Agency and Anti-Corruption Council are only of marginal importance.
Optimal Structure for Coordination
As demonstrated in the above, coordination is a vital aspect of implementing the Anti-Corruption Strategy. Because of the dense connections among areas and activities, it is probable that results and activities need to be well timed, so that the strategy will be an overall success. In order to determine the coordination capacity more precisely, it would be useful to know, if there are subsets of actors, which require more coordination, and others which need less of it. For instance, agencies, which are more closely connected via areas, objectives or activities, may need to meet more often, or have more formalized coordination processes. Also, agencies, which need to coordinate closely with a large number of other players may require more support and supervision than agencies which work in relative independence. The following graph uses a “modularity” algorithm, which measures how well a network decomposes into modular communities. A high modularity score indicates a sophisticated internal structure. The chart below displays the modularity by activity, identifying five groups of agencies (each having a different colour), which differ from each other in the intensity in which they work on common activities. In order to organize the work around those activities, it may be useful to consider establishing regular meetings among the “members” of those “groups”.
Year-by-Year Comparison
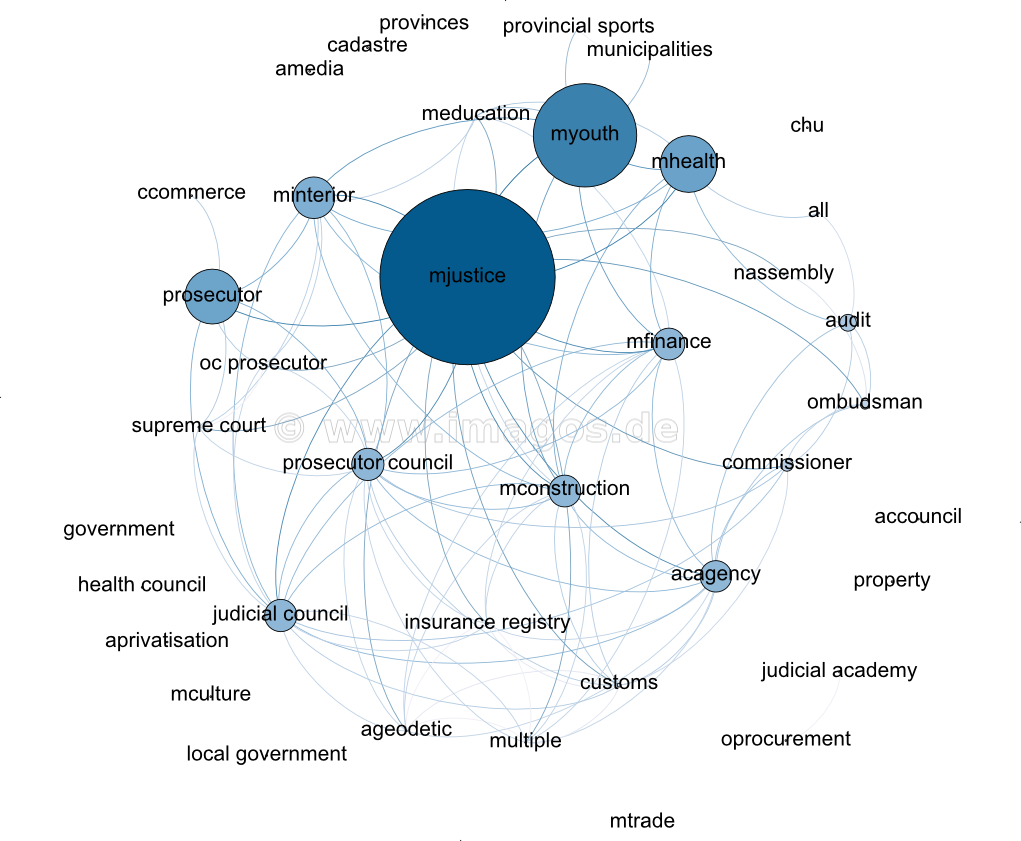
This section splits the entire implementation period into annual sections and analyses the centrality of the various stakeholders at the level of activities. Rather expectedly, the Ministry on Justice and Public Administration remains the dominant coordinating force in each of the years of implementation. The first year involves 39 active organizations with 101 activities that require coordination. Apart from the Ministry of Justice, the main coordination efforts involve the Ministry of Youth and Sports, and the Ministry of Health.
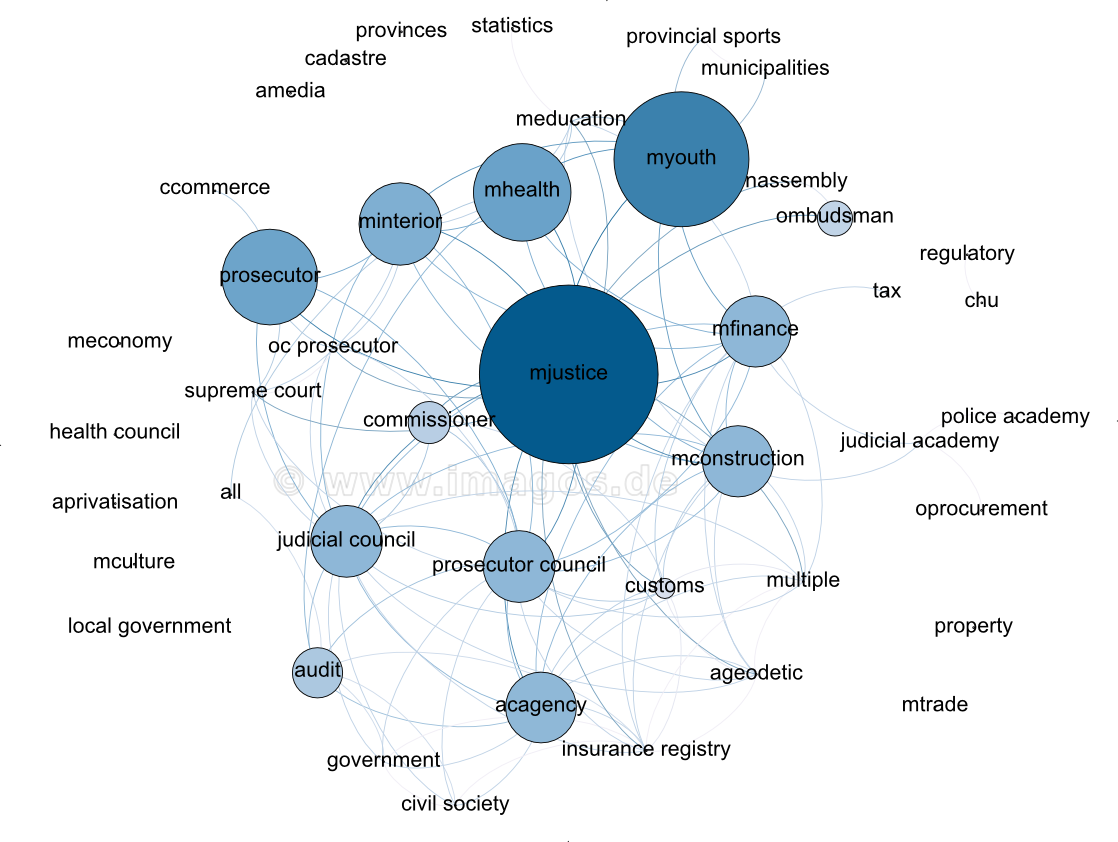
In Year Two of the implementations 44 organizations share a total of 116 activities with other organizations in the same sector. While the Ministry of Youth and Sports and the Ministry of Health remain rather important, the Ministry of Interior and the Public Prosecutors Office take a more exposed role in coordinating activities.
While the number of active organizations drops to 33 in year three, there is a very sharp fall in coordination problems from 116 to 65. The relative role of agencies from year two does not change substantially.
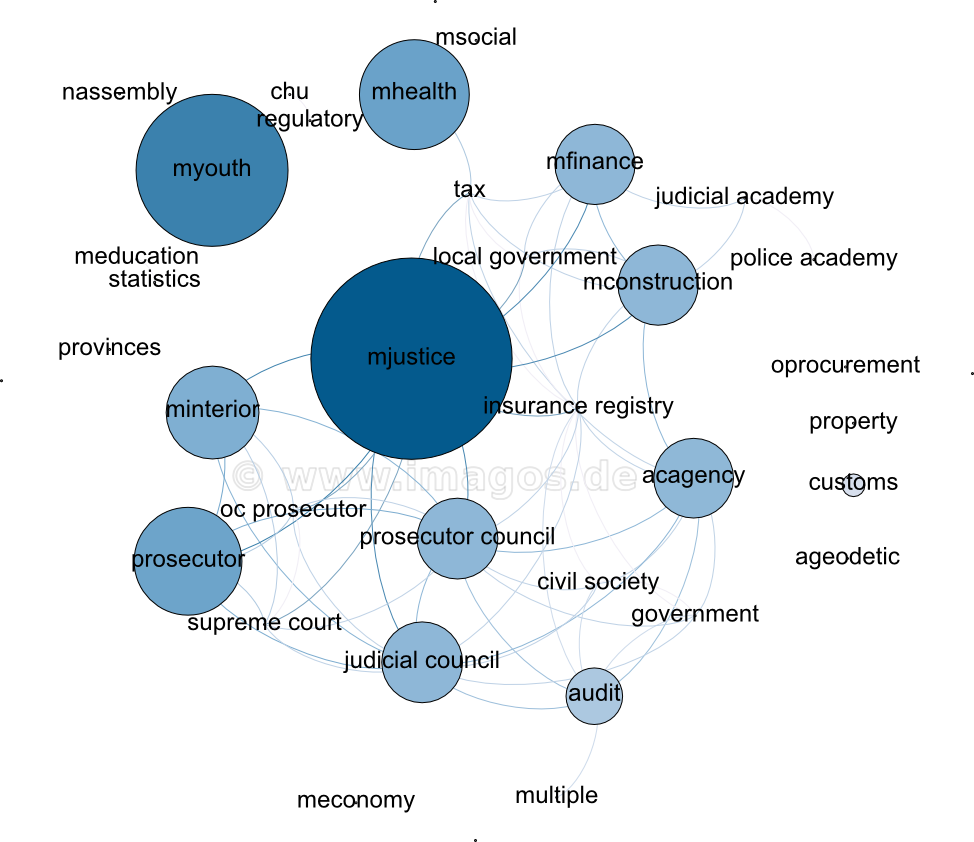
In year four, there is again a sharp drop in the number of activities requiring coordination, down to 15. Also, the number of active agencies declines sharply to 15. In this year, Government becomes more central..
Overall activity and coordination bounce back in the last year of implementation to 33 organizations and 61 activities to be coordinated. The figures for the last year may be distorted, though, because many activities were timed to end with the implementation phase of the action plan, while in fact they may be completed earlier, or later.
Conclusions
The graphic analysis presented in the above can be used to formulate a number of findings and conclusions, which are hidden in the tabular textual presentation of the Anti-Corruption Strategy and Action Plan:
- Many activities cut across several agencies. Horizontal coordination will thus be indispensable. The centrality of actors for coordinating the implementation of the Anti-Corruption Strategy depends on the results level in focus. At the level of activities, the Ministry of Justice is the dominant agency through the whole period of implementation. At the level of objectives and areas, the Serbian Government and the Serbian Parliament are central. Thus, even if activities were perfectly coordinated, results will only materialize if Government and the National Assembly are able to coordinate the different areas and objectives constituting the strategy.
- Coordinating 49 agencies in the implementation of the strategy can be a daunting task. The task can be greatly facilitated by structuring the system of agencies into groups or communities, which differ from each other in the extent to which they share the same activities and objectives. This can be achieved by using a modularity algorithm. In each sub-component, centrality measures can be used to identify a lead agency. That way the system can be coordinated optimally by only a few central agencies, without overburdening some players. The best-suited actor is the one who is the best connected, i.e. is linked to the largest number of actors within his sub-community. The identification of the best connected actors would require separate analyses for each of the sub-communities.
- The extent to which coordination is needed changes significantly over time. If one assumes that it takes time to build up coordination capacity, demand for coordination should gradually increase from year to year. This is not the case in the current example. The required coordination capacity is largest in the first two years of the implementation, and then drops in subsequents years. It may be useful to revise the action plan in a way that capacity can be developed in parallel to gradually increasing demands toward performance.
- The strategy itself represents a structure, which is difficult to influence or manipulate purposefully by an individual party. A change in one objective or increased investment of one agency in specific area or objective, will change the entire constellation. If the number of agencies active in a specific strategic area changes, or the number of objectives addressed by a specific agency shifts, the system will need to find a new equilibrium. In many instances, agencies or groups need to succeed in an environment that changes faster than their hierarchies can respond. Since the equilibrium is a result of iterations, finding this new state in a social system is usually time consuming. The system may not be able to adapt quickly enough, which may go so far as to lead to crisis. To avoid such situations, it may be useful if the participants in the system become aware of the ideal configuration through simulation, so as to know the positions, which are optimal for the system. (Unfortunately Google has stopped supporting Fusion Tables, so that this point is currently not visualised).
