The focus of the Graphic Analysis of Policy Cooperation is to evaluate the location of actors in the system rather than their individual attributes. The size of nodes therefore does not necessarily indicate how influential an actor is. What matters are measures around the centrality of a node. These measures provide an insight into the various roles and groupings in the system — the connectors, leaders, bridges, isolates, clusters, core of the system, and who is on the periphery, and who is central.
The graphs discussed below are the result from the application of the Force Atlas Algorithm on data on EU Member States (MS) and Cooperation Areas (CA) in Vietnam. Circles or “nodes” represent MS and CA. A line or “link” connecting an MS to a CA indicates a strategic involvement of that MS in the CA. The larger the number of connections of a node, the bigger is its size. MS with a larger number of strategic cooperation activities (agreements, consultations) are assigned larger nodes. CA supported by more strategic cooperation activities will also be larger in size. An MS node of the same size as another MS node but with fewer links is more focused.
Thicker lines between an MS and a CA mean that an MS has more strategic cooperation activities in that CA. The fewer strategic cooperation activities exist between an MS and a CA, the stronger will be the repulsing force between them. The more strategic cooperation activities exist, the stronger will be the attracting forces. In the data used, most MS and CA are very strongly connected, while few are very weakly connected.
The behaviour of the graphs under these forces is simulated as if they were physical systems. In this simulation, the forces are applied to the nodes, pulling them closer together or pushing them further apart. This is repeated iteratively until the system comes to an equilibrium state, so that their relative positions do not change anymore from one iteration to the next. The graphs converge the system of strategic cooperation to a unique global optimum configuration.
For instance, Spain and Germany both strongly support climate change activities, but Germany is more central to this issue than Spain. This is because Spain has weaker ties to MS supporting climate change activities than Germany. If Spain wanted to increase its influence on climate change, then it would have to either strengthen its ties to other MS that strongly support climate change activities, by expanding on relevant other cooperation activities which it shares with those MS (indirect influence), or by investing more in climate change activities (direct influence). However, the consequence may be that Spain will lose its centrality to other important areas, such as culture and education – even if it keeps its support to these activities stable. Since the consequences of such changes are not easy to foresee, simulations can be an important element of decision-making.
If the number of MS active in a specific strategic cooperation area changes, or the number of CA addressed by an MS changes, the system will need to find a new equilibrium. Since the equilibrium is a result of iterations, finding this equilibrium in a social system is usually time consuming. The system may not be able to adapt quickly enough, which may go so far as to lead to crisis. In many instances, groups such as the EU Political Counsellors need to succeed in an environment that changes faster than their hierarchies can respond. Therefore, it may be useful if the participants in the system become aware of the ideal configuration through a simulation, so as to know the positions, which are optimal for the system. The EUD or other MS may help each other to move into their new and improved positions.
Overview
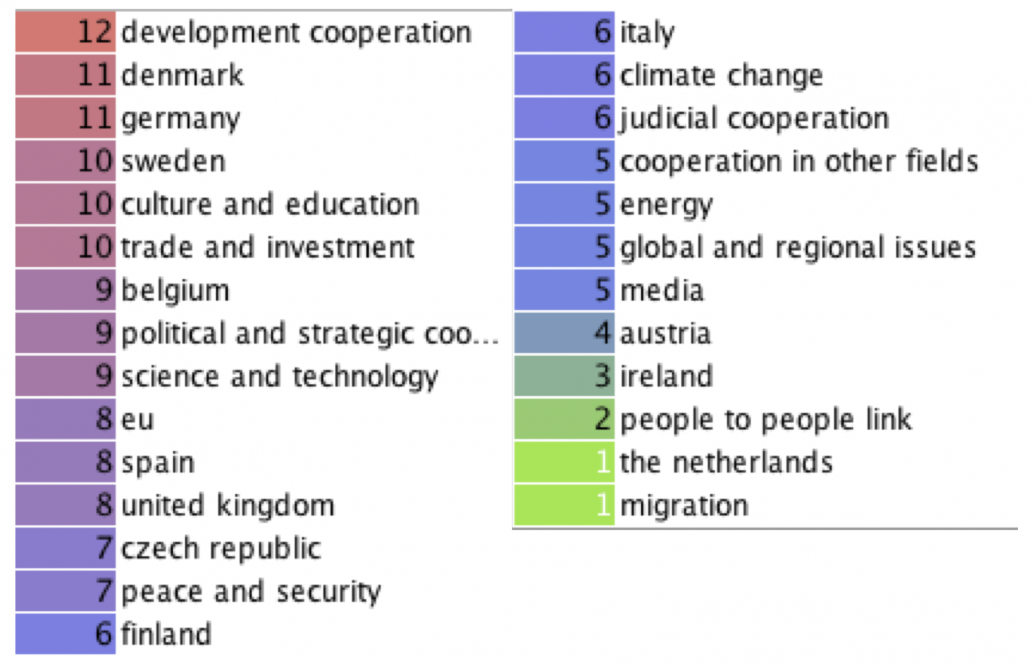
The following charts represent data currently available on strategic cooperation ranked by degree of connection:
Bridging Countries and Issues
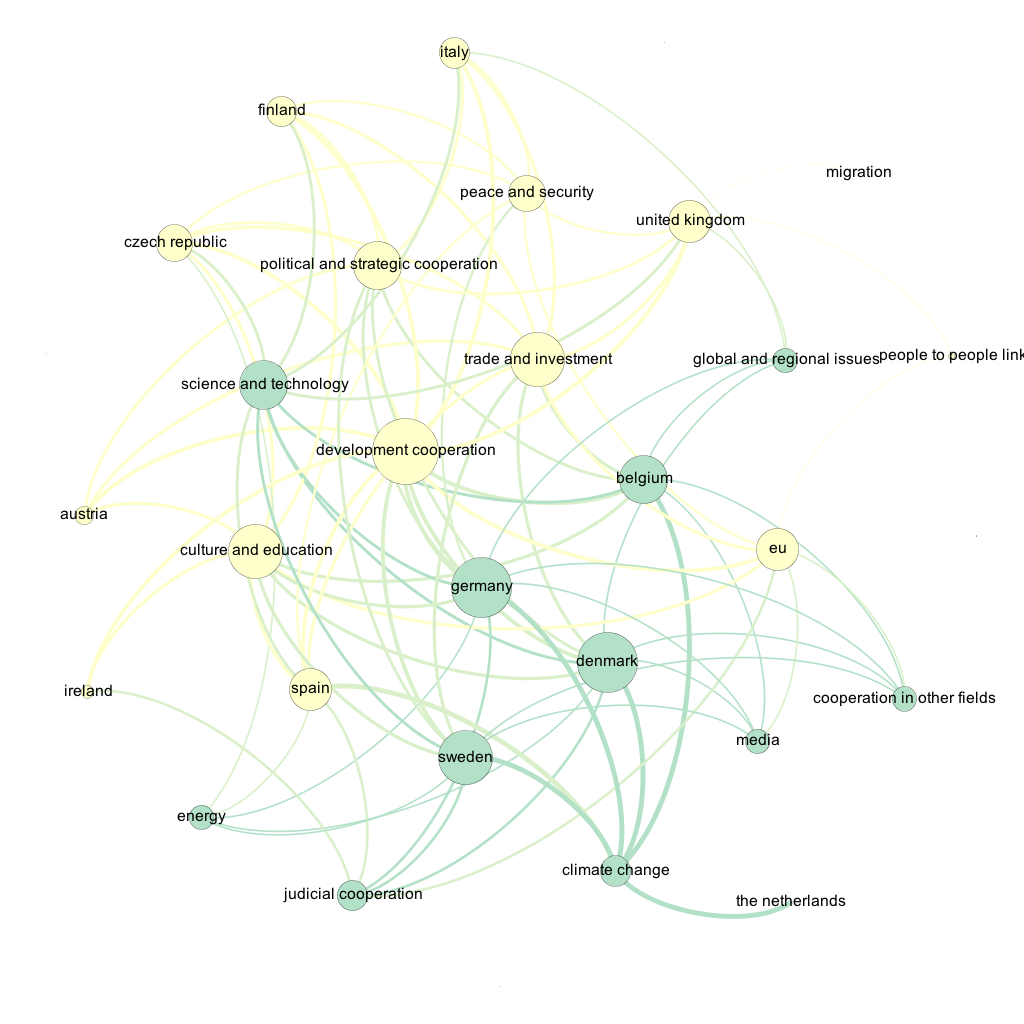
On average, every MS supports six CA, and every CA has six MA supporting it. Development cooperation, however, is supported by 12 MS. The system density, i.e. the proportion of node per link is 20%. Denmark and Germany are most involved in strategic cooperation, followed by Sweden and Belgium.
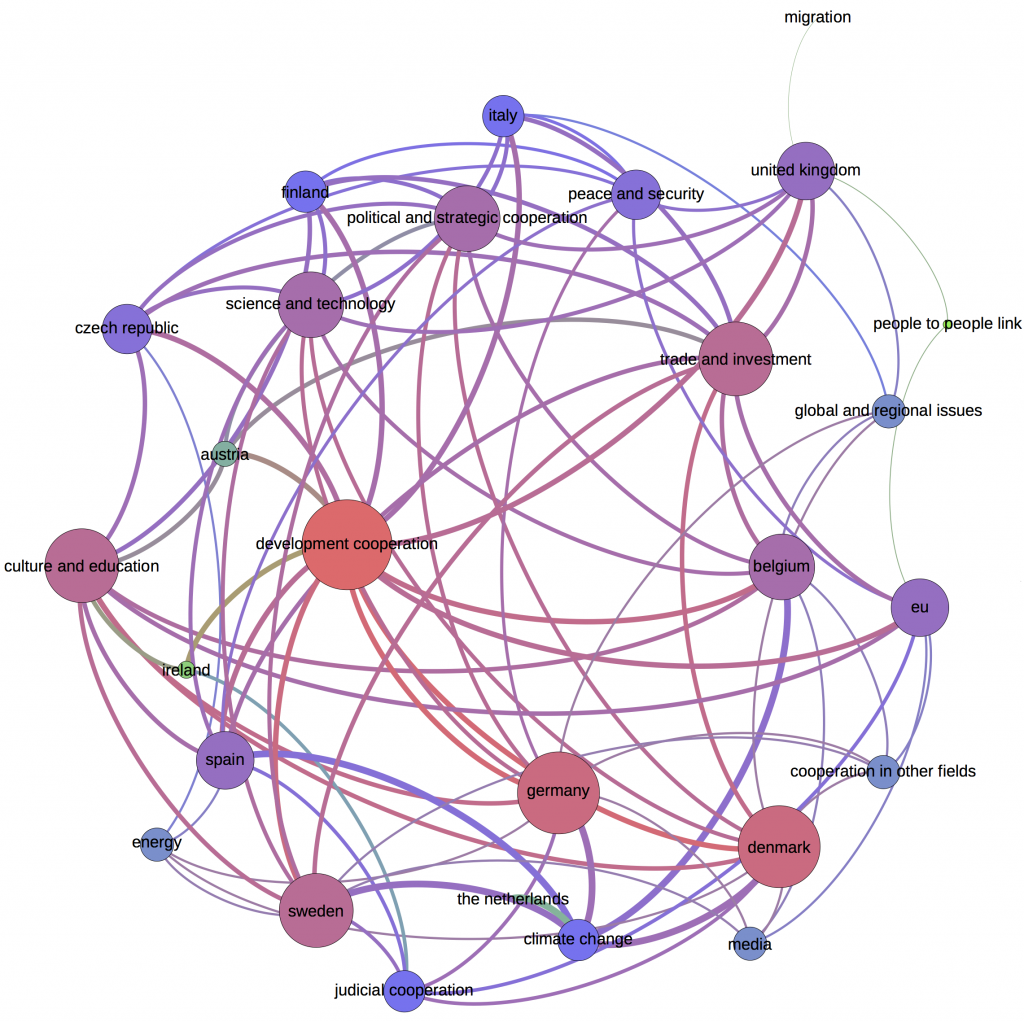
The graph below shows that “development cooperation” has a rather high centrality. Almost all EU/MS are connected to it. This means, for instance, that if one MS changes its engagement in development cooperation, the decision will probably affect all other MS. One can also see that “migration” is a rather “eccentric” and disconnected area, while the topic of human rights (Art. 35 PCA) is completely missing.
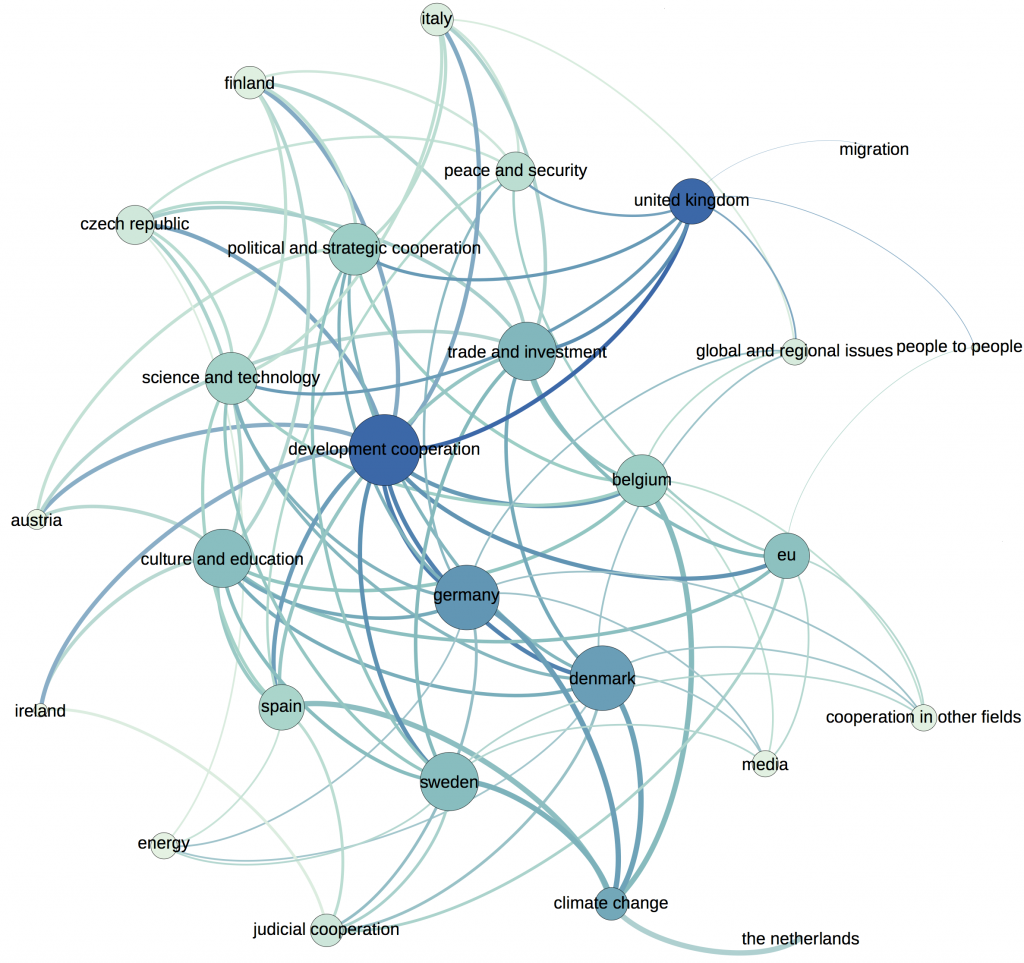
Betweenness centrality quantifies the number of times a node (Member State or Cooperation Area) acts as a bridge along the shortest path between two other nodes. The Member State with the highest centrality is the United Kingdom, i.e. for many issues the UK is a central actor (but not for all). For instance, if there is uncertainty about who is central to a strategic cooperation area, the most rational choice would be to talk to the UK first (the following charts use the Fruchterman algorithm).
System Structure
The system currently has a weak structure (modularity), as shown in the graph below. This means that everyone is doing a little bit of everything. Denmark, Germany, Sweden Belgium and the Netherlands are more influential on issues of global and regional cooperation, science and technology, energy, judicial cooperation, climate change, media and cooperation in other fields. Finland, the Czech Republic, Italy, the UK, Austria, Ireland, Spain and the EU are relatively more engaged in development cooperation, culture and education, trade and investment, political and strategic cooperation, peace and security, and migration.
The advantage of a weak structure is that everyone is at a similar level of information on the areas of cooperation and the activities of other MS. Information cannot be easily used as a source of power and there is little “clique building”. In a system where trust is low, this may be a preferred way of working. Disadvantages of this arrangement are that low levels of specialisation reduce the potential for innovation. The cost of communication will also be high, reflected e.g. in much time spent on meetings and with e-mail communication.
Optimising Influence
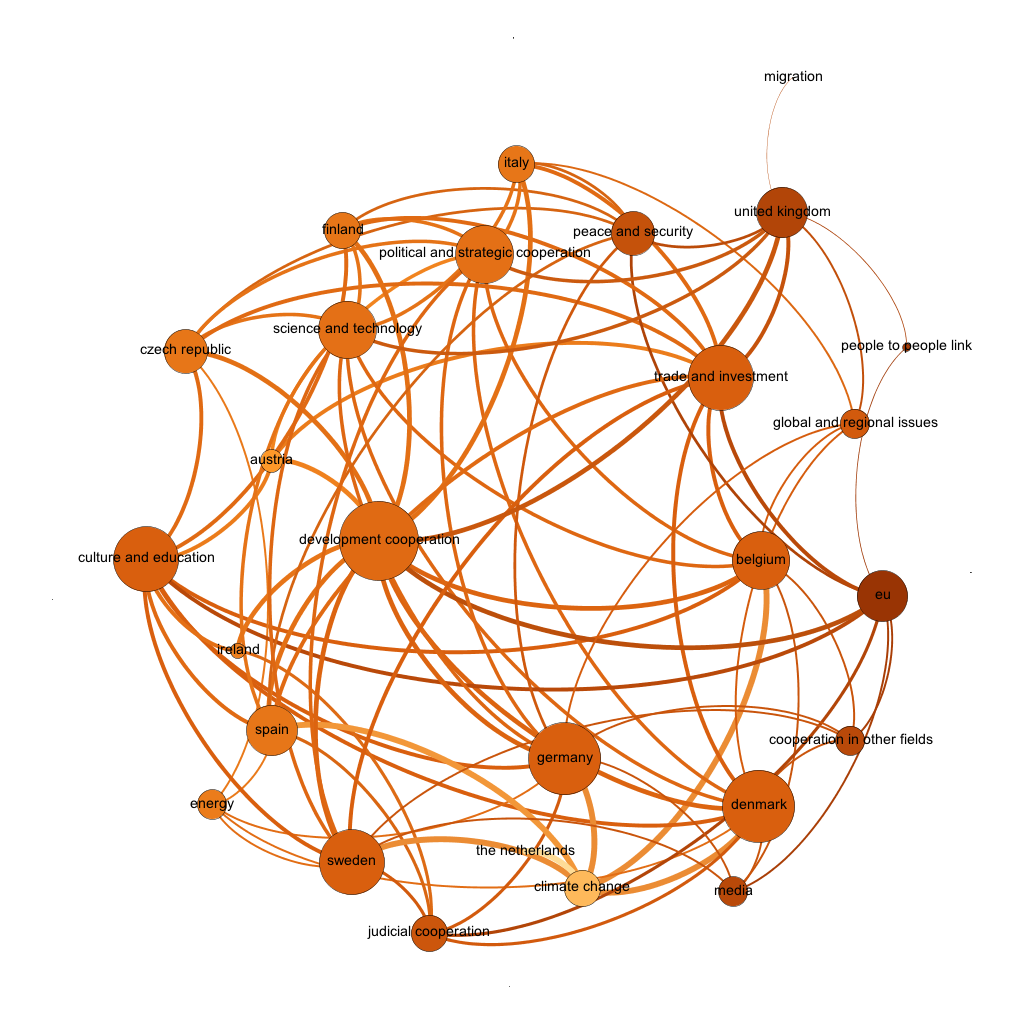
The heatmap chart below depicts the influence of the EU on MS and Cooperation Areas. The darker the nodes, the better connected is the EU to these nodes. Lighter coloured nodes represent areas in which the EU has limited influence. If the EU wants to become more influential in climate change, then it will need to either cooperate more closely with Denmark, Sweden and Germany, or seek a direct cooperation in this field. All other variables unchanged, however, it will necessarily do so at the expense of its good connections in other areas.
Increasing Influence Without Direct Investment
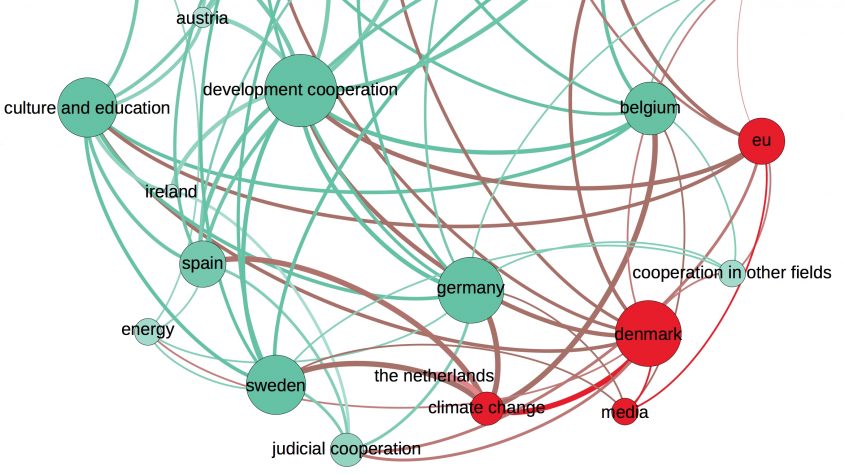
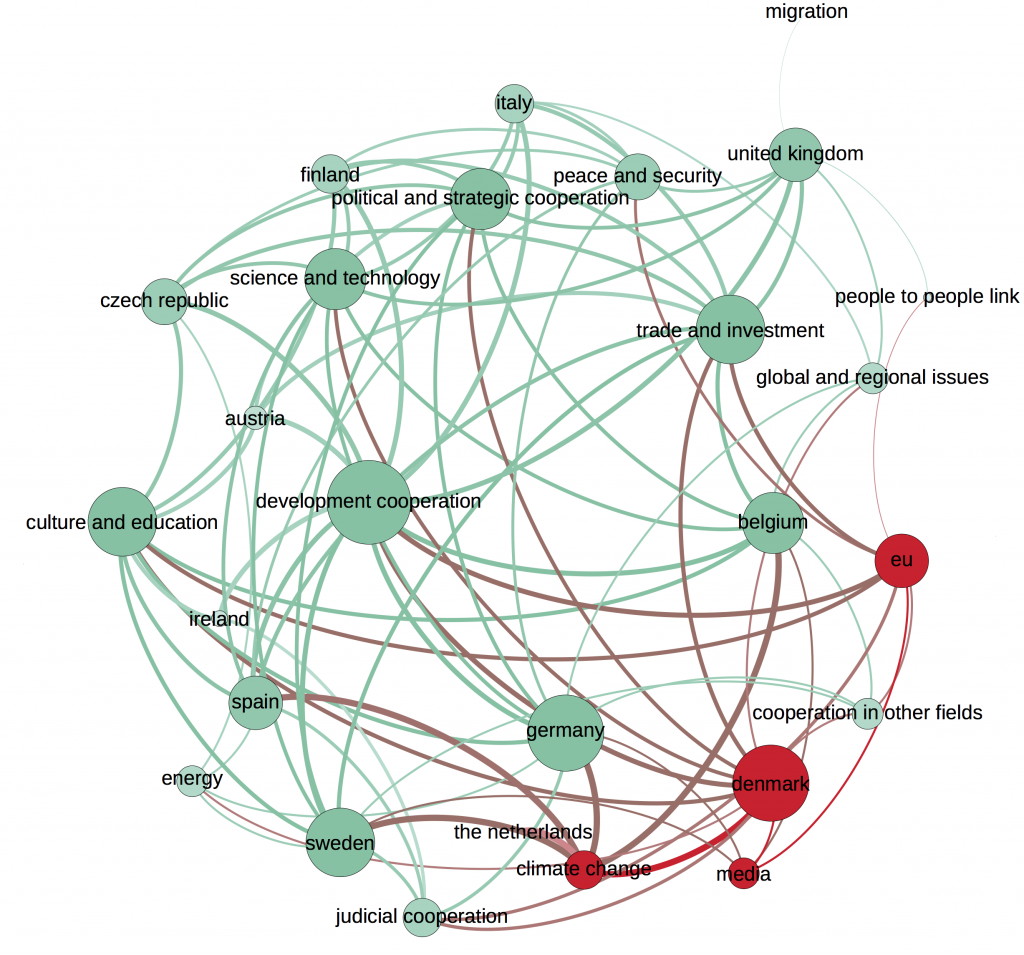
If, for instance, the EU wanted to increase its engagement in the area of climate change, without directly investing into this area, there are several options with the same path distance. One option, as shown in the graph below, is that it use its cooperation with Denmark in the area of media in order to discuss climate change.
This approach reveals also a weakness of the current data, in that the EU has alternative and possibly more effective ways to engage with its Member States than via topical areas. Data on these alternatives (e.g. EU treaties, communications, directives, regulations, etc.) would in principle need to be entered into the database informing the mapping process.


 Bob Brewer